If you think your business’ data is simply about numbers or charts, you’re not seeing the full picture. And, if you think data is about looking backwards and creating important-looking slides for your next presentation, you are missing a big opportunity.

Data is about telling a story, and these stories create direction, action, and efficiency in your company.
In many businesses, data is used to steer strategy, measure customer satisfaction, and motivate staff.
My friend, Jon Thompson, lays out how “companies can utterly transform themselves by simply improving visibility into key metrics,” in his book, The Dashboard Effect.
He writes, “[Data] has the power to elevate accountability and initiative. It can increase motivation and create a sense of ownership at all levels of the organization. It helps keep everyone focused on common, measurable goals, and it removes the barriers between managers and employees.”
How Sales Dashboards Keep Sales Teams Accountable and Driven
If you zero in on the most consistently productive sales organizations, you’ll notice that they run on data. Actionable sales data is used to pivot quickly when market conditions or buyer behavior shift.
Data is also used in sales rep coaching, determining who to reward, and ensuring everyone is following the most effective lead management processes.
However, if you wait until the end of month or quarter to tell your team or individual sellers how they performed, you are missing chances to optimize your results, motivate your team, and keep your sales reps accountable throughout the month.
FREE CHEAT SHEET: 9 Mistakes People Make When Trying to Increase Sales Using the HubSpot CRM
Shared online sales dashboards or leaderboards displayed on a TV in your office reinforce your focus on key metrics during daily sales activities. These dashboards and other charts drive accountability and keep sales reps focused on the performance and process data that matter most to their success (and your company’s success).
Organizing, tracking, and strategically presenting your sales data is directly linked to ensuring the success of your sales team, retaining top performing sales reps, and the long-term growth of your business.
In this article, we’ll walk through how you can set up HubSpot sales dashboards to increase revenue and sales rep productivity for your business.
What Is a Sales Dashboard?
A sales dashboard is a visual presentation of your sales data. Examples of metrics that can be tracked include deal revenue, deals closed (total vs. goals), and team activity totals.
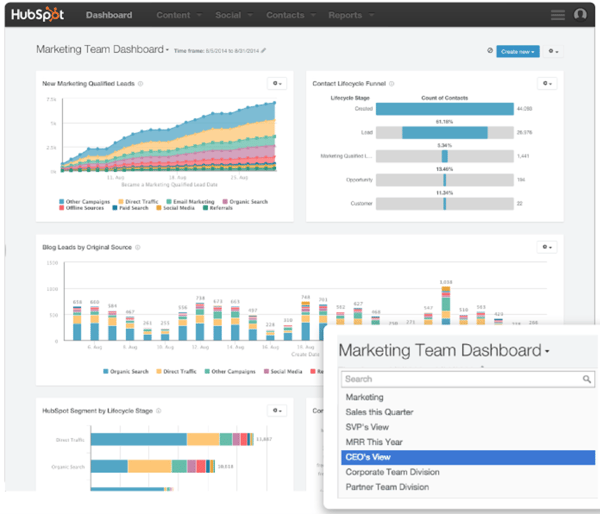
When you create shared sales dashboards, you carefully design dynamic visual aids from hand-picked metrics to drive specific action among your sales reps. These leaderboards are made available for your sales team to see throughout their workday, either online or on a big television in your office.
Why Should You Use Sales Dashboards?
Sales dashboards provide an overview of your key performance indicators and display the progress of your sales team. Sales leaders can use these metrics to make decisions, award successful performance, and identify issues before they become legitimate problems.
More specifically, sales dashboards can:
- Track individual sales performance in real-time
- Track team sales performance in real-time
- Directly compare performance across multiple sales metrics or KPIs
- Use friendly competition to fuel motivation in the sales team
- Create a transparent, data-driven work environment
- Make quick decisions based on the data instead of waiting for end of quarter reports
How to Create a HubSpot Sales Dashboard
Step #1 - Identify Your Key Metrics
The first step to creating a sales dashboard is to identify which sales metrics you need to track in your specific business. This task can seem overwhelming because instinctually you may want to track every possible detail of your sales process.
Before you approach that slippery slope, here are a few main categories of important sales metrics to track:
- Sales Key Performance Indicators (KPIs) measure company-wide performance. Examples include total revenue, revenue by product line, market penetration, and year-over-year growth.
- Activity Sales Metrics measure what sales reps are doing on a daily basis. Examples include number of calls made, number of meetings scheduled, and number of emails sent.
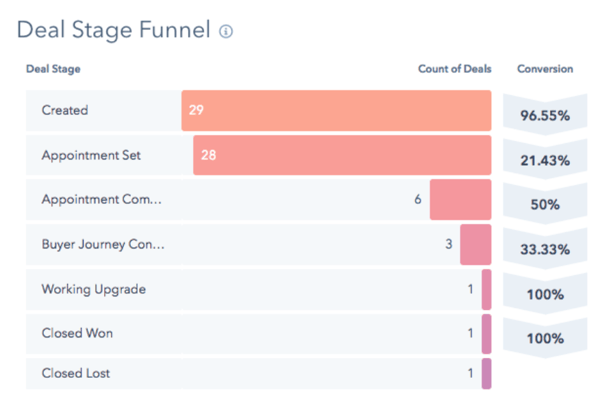
- Pipeline Sales Metrics measure the overall health of your sales pipeline. Examples include average length of sales cycle, win rate, and conversion rate by sales funnel stage.
Step #2 - Identify Who Will Use Which Dashboards and How
Once you’ve identified your most important metrics to track, your next step is to decide how the sales dashboard will be used and by whom.
Maybe you need one sales dashboard that is for your sales rep to track their daily activity, progress, and goals. This sales dashboard will also be accessible to managers and executives to track performance, highlight areas of opportunity, and reward achievements.
You may have other sales dashboards that are only visible to managers and executives, such as those that track overall company revenue and growth.
Remember that location is key when it comes to sales dashboards. Besides having sales dashboards accessible from their workstation, many companies choose to display their dashboards on TVs throughout the office. TV displays can increase sales team productivity for many reasons, but mainly they work to keep your team’s objectives visible, palpable, and obtainable.
Step # 3 - Connect Data to Your Dashboard
Your next step is to feed your CRM’s data into your sales dashboard. HubSpot makes this step simple by allowing you to literally point and click on different data points from your customer database. On a sales dashboard, these data points can track sales performance, team productivity, create sales forecasts, identify top performers, track deals closed vs. goals, and much more.
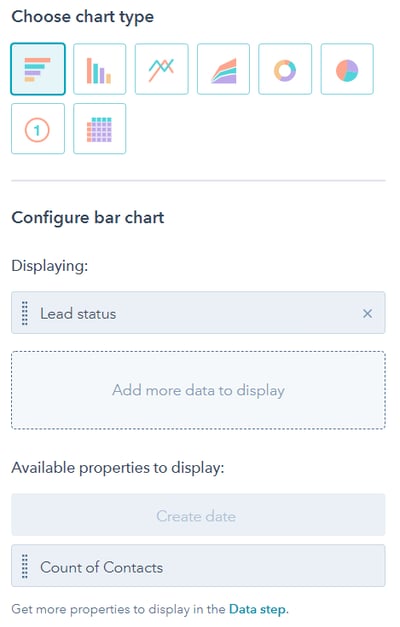
Step #4 - Build Reports for Your Sales Dashboards
The last step to creating a sales dashboard is to build your reports so that you’re able to visualize (or chart) your data in the easiest way possible. There are several different options for charts on your sales dashboard and below is a quick overview of some of the main types.
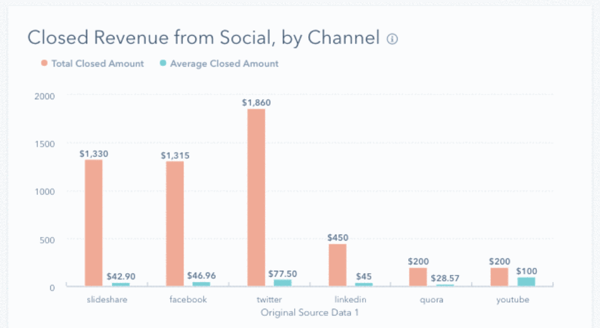
- Comparing values reports can be used to compare results from one territory to another.
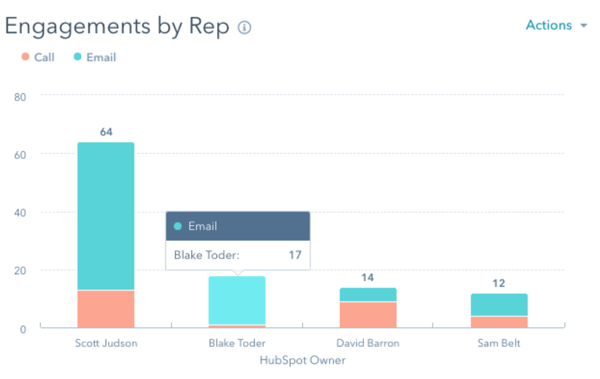
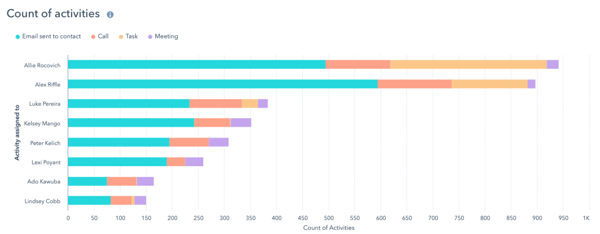
- Composition reports can break down sales rep activity by each individual sales rep.
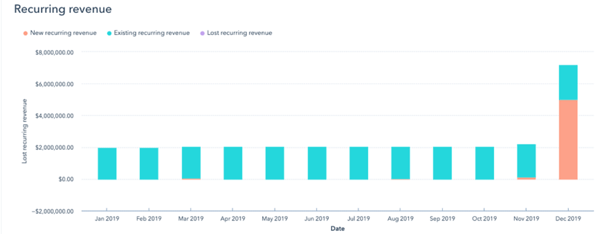
- Trend reports can show month over month revenue growth (along with several other important KPIs).
These charts should be as easy to read and understand as possible so that your sales reps and executives don’t need to spend too much time clicking through reports and data.
By giving your team a quick snapshot of their key data points, you’re keeping your team connected and accountable for the company’s performance.
Sales Dashboard Tip for 2020 and Beyond
As more and more companies move to a remote location/work-from-home format, you need to be sure everyone in your company has access to their sales dashboards from anywhere in the world.
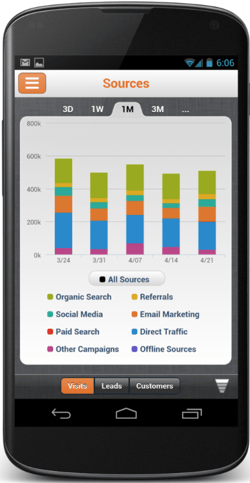
Make sure to utilize mobile-friendly sales dashboard options whenever possible to give employees access from their phones, tablets, or home computers. Easily accessible and real-time sales dashboards will keep your sales reps connected and aligned with your company’s goals.
How to Use Shared Sales Dashboards or Leaderboards to Motivate and Manage Sales People
Once you’ve got your sales dashboards up and running, there are several ways you can maximize their potential for your specific business. Below are a few helpful tips that can help you along your sales dashboard journey.
Tip #1) Highlight the right metrics.
Focus more on behaviors (making calls, sending emails, etc.) vs. money ($ closed sales). After all, some sales people get bigger accounts or better geographies and the odds are stacked in their favor from the get-go.
Tip #2) Don’t ignore anyone.
A lot of sales dashboards are incorrectly set-up to draw attention to top performers and low performers. Meanwhile, the middle guys end up feeling alienated. One way to bring attention to every type of performer is to highlight several KPIs and more than likely, each sales person has at least one metric in which they excel.
Tip #3) Be sure the competition is sales people vs. benchmarks (and not sales people vs. sales people).

After all, you want everyone to work together towards a common goal and not become enemies and/or create animosity in the workplace.
Tip #4) Create competition around self-improvement.
Highlight those that are improving their own numbers, not just those that are increasing the company’s numbers.
Tip #5) Offer compelling rewards and incentives.
Some people won’t be motivated by bragging rights alone.
Tip #6) Praise in public, criticize in private.
Don’t draw attention to low performers. If your sales dashboard highlights the top performers, it should be motivation enough to want to see your name on that list. Seeing your name on a sales dashboard that lists the underperformers is shameful and embarrassing. Underperformance should still be tracked, but discussed in private when necessary
Tip #7 Real-time updates and alerts are exciting and motivating.
Be sure your metrics can be tracked in real-time so the sales team can celebrate successes immediately and make game-time changes when necessary. 
HubSpot Sales Dashboards Takeaway
You need to know where the starting line is before you can win a race. This same rule applies to your company’s sales process. In order to reach its ultimate potential, you need to know where your company stands today.
As a sales manager/executive, using HubSpot sales dashboards and leaderboards can provide you with real-time actionable data. This crucial data allows you to move forward, pivot, or change course quickly to keep up with our ever-changing business climate. For sales reps, sales dashboards can be a motivating tool that keeps everyone aligned and connected to the team and company’s goals.
Whether you need to analyze your sales reps’ individual or team’s productivity, create friendly and fair competition between your sales reps, or use data to make quick decisions, HubSpot sales dashboards can provide you with the insights you need for your company today.